Your brief was one sentence: a consolidated dashboard where he can see Profit, Orders, AOV, etc. It should be an interactive dashboard.
This is that board — Shopify orders, refunds, COGS and ad spend on one page, every number re-computed by the three filters below. Structure is real; the numbers are illustrative.
Bars are net sales after discounts and refunds; the line is order count. Highlighted months are inside the selected period.
The three questions the store owner will actually ask, each answered from the current filter.
Where each dollar goes before it becomes contribution profit. Every step is a Shopify or ad-platform field.
Bar = net sales share of the selection; right column = gross margin after COGS.
A typed question, answered from the same model — the pattern we build on a private AI server.
One hanger per category, one swatch per size. Swatch width = units sold in the selection; colour = return rate for that size. This is the sizing-chart conversation, drawn.
Net sales by channel, with return on ad spend where the channel carries paid media.
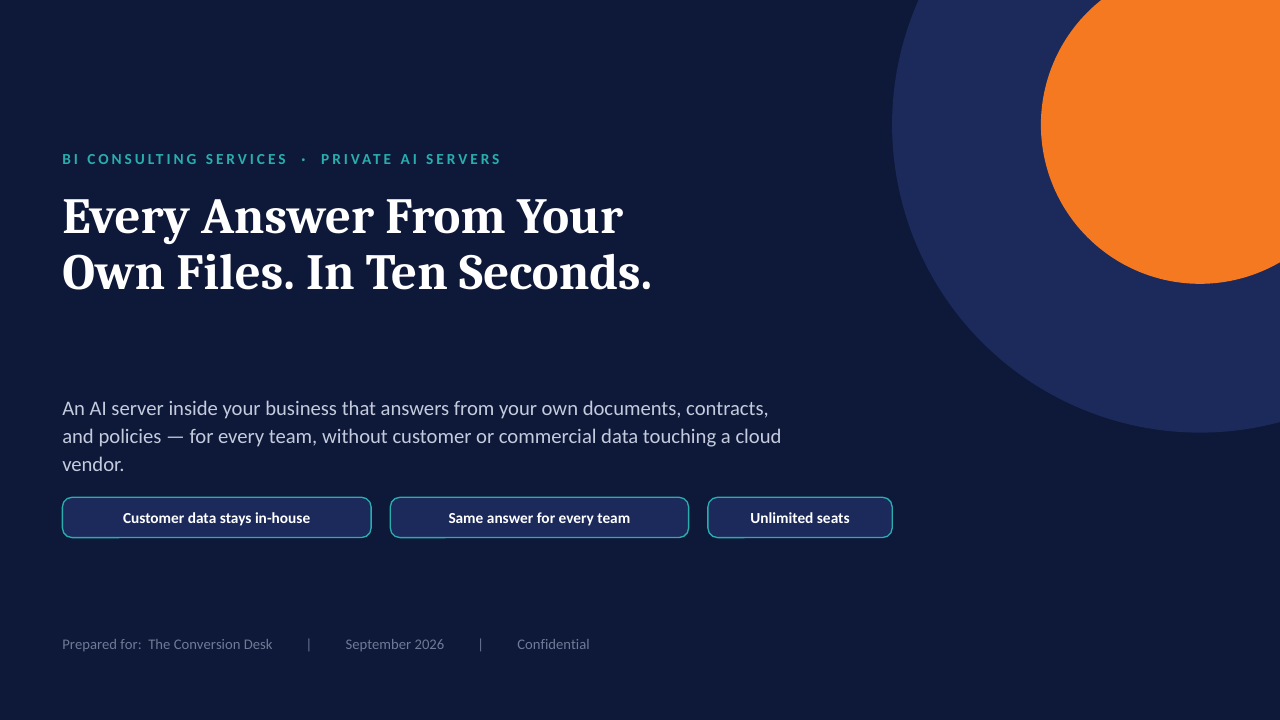
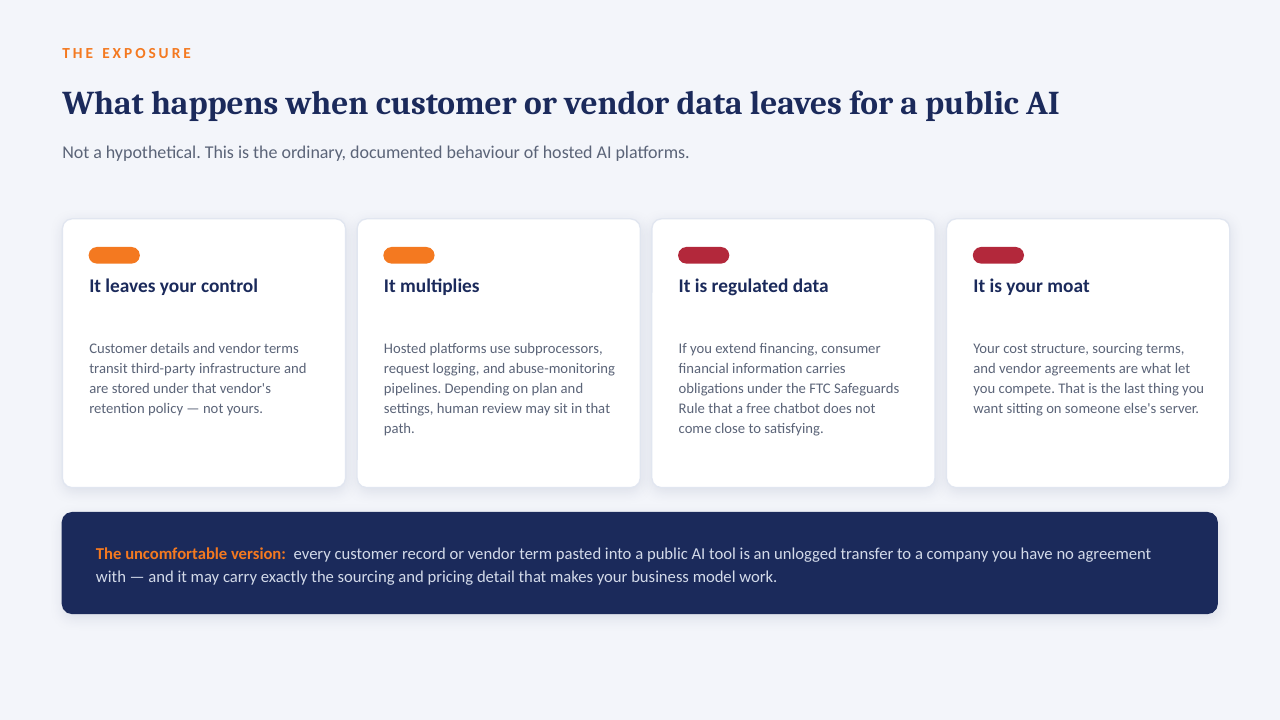
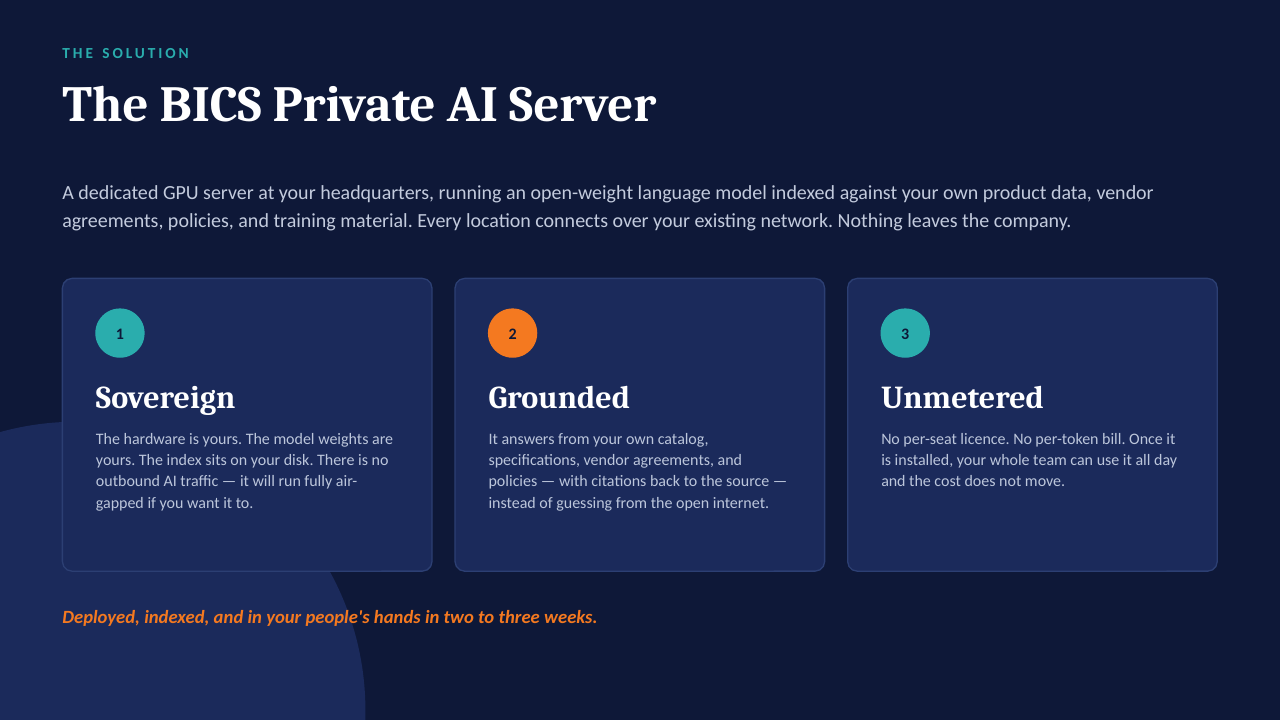
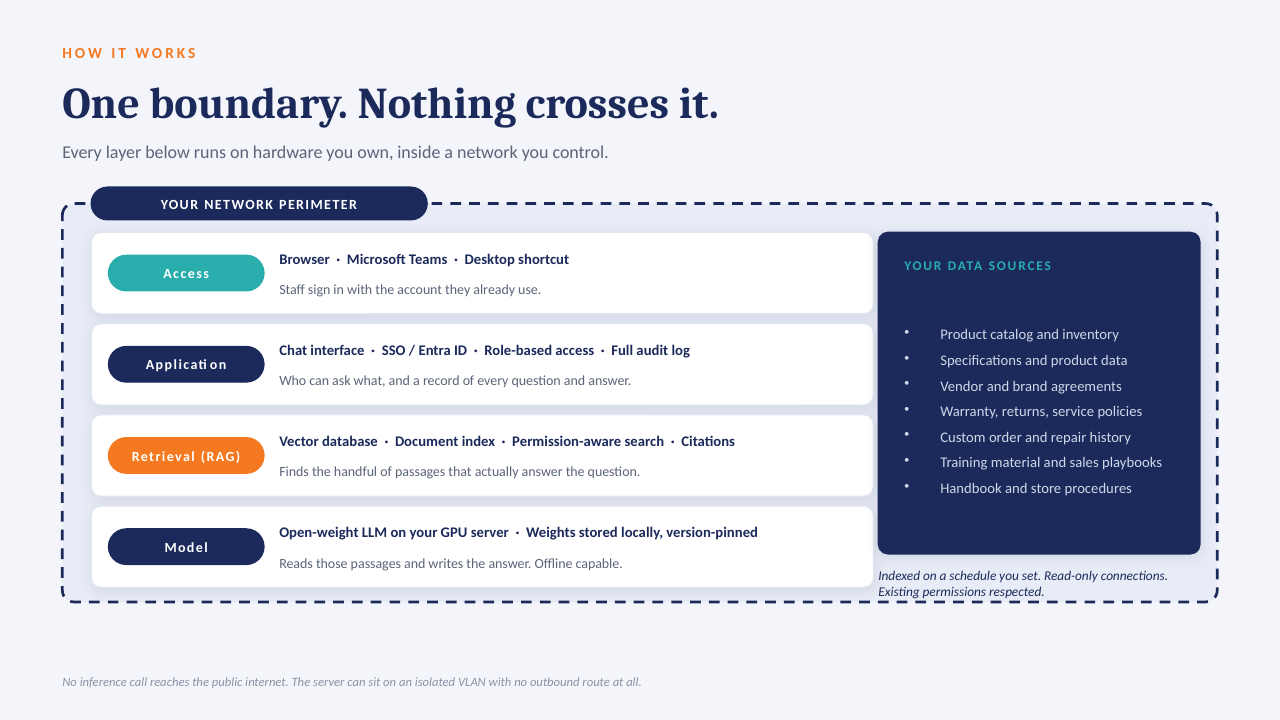
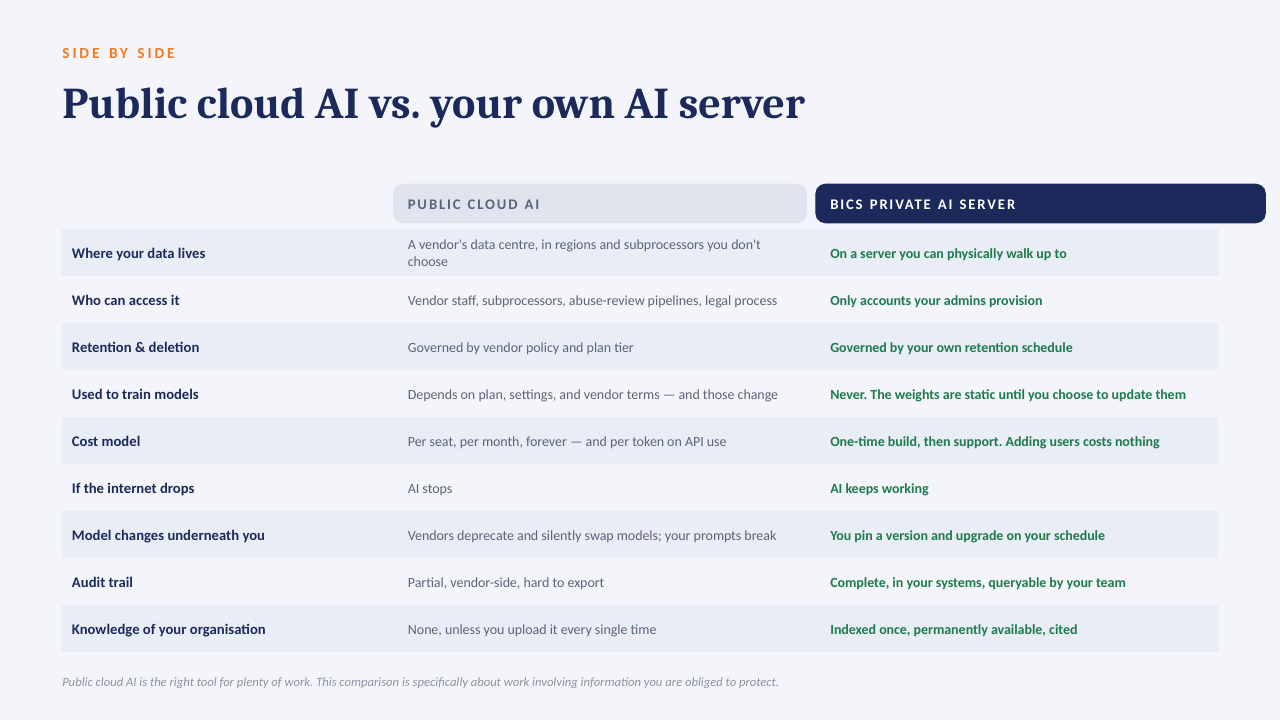
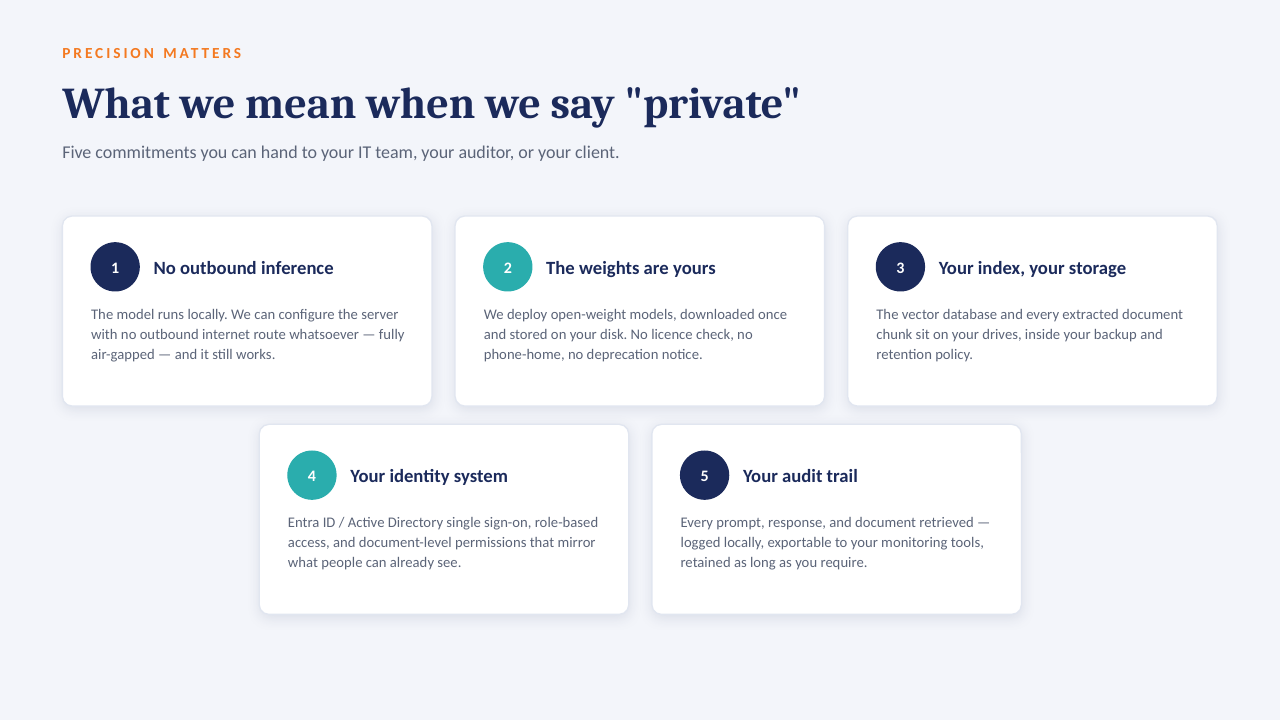
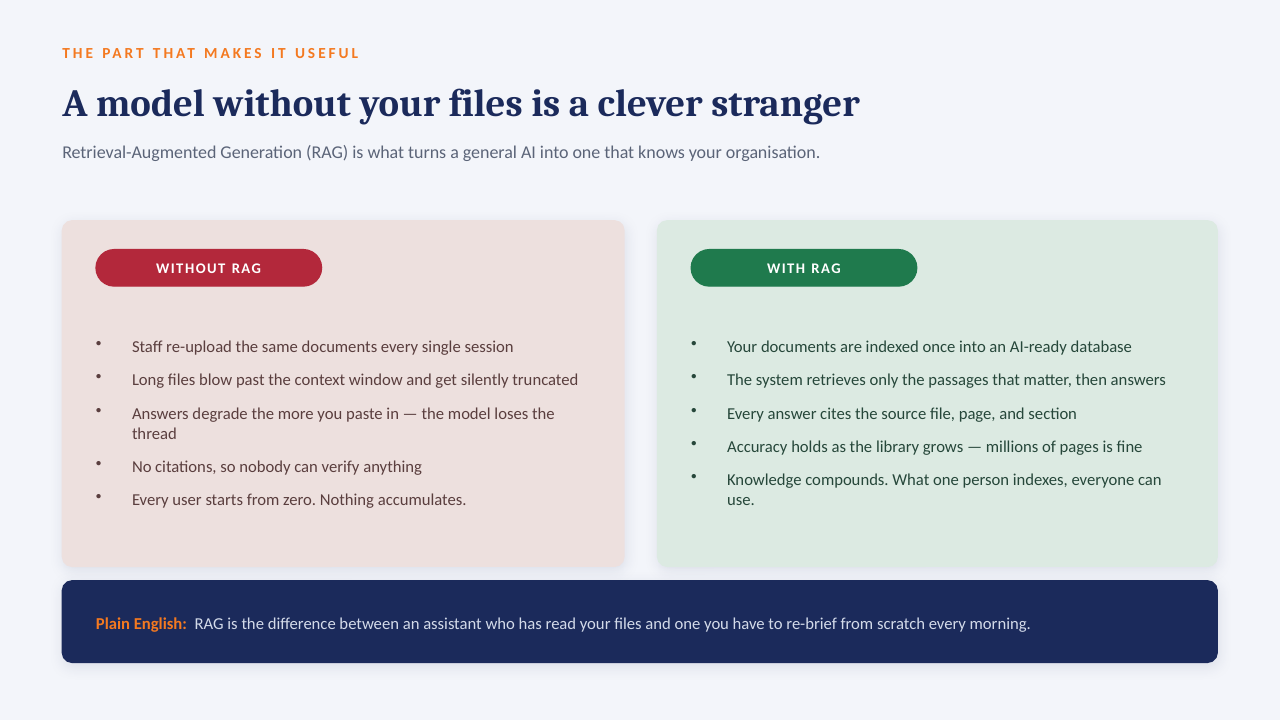
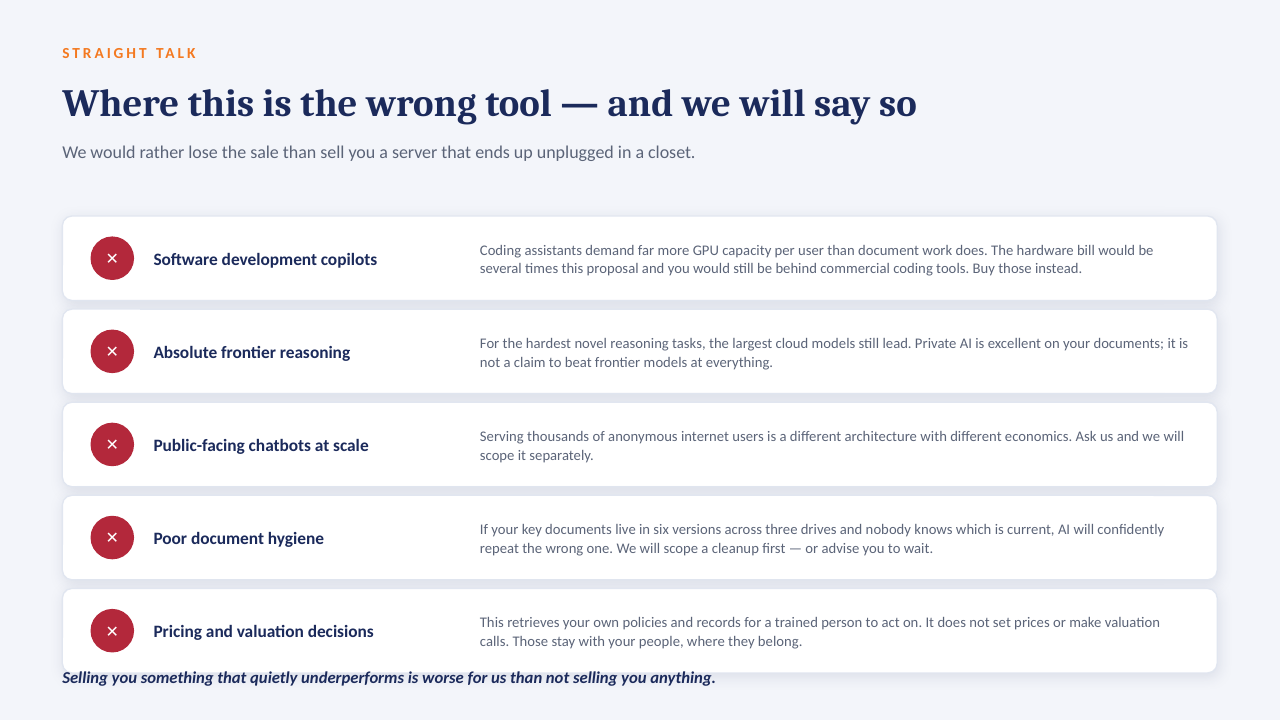
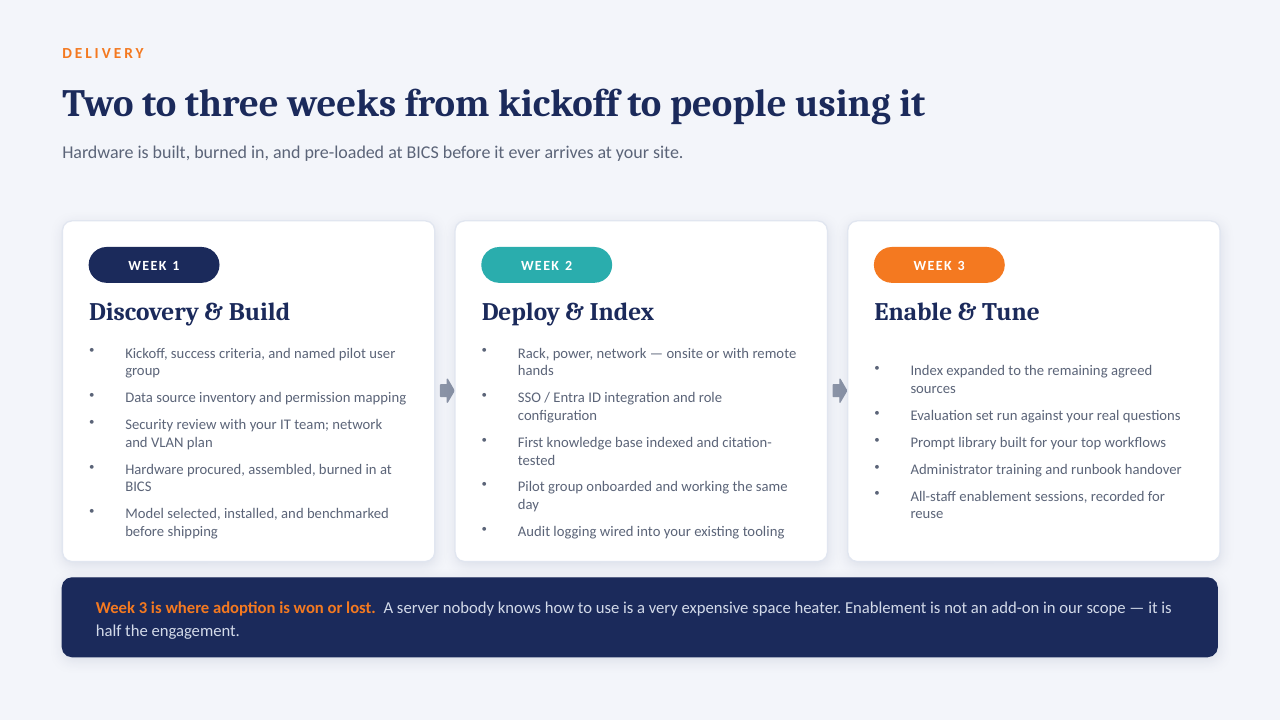
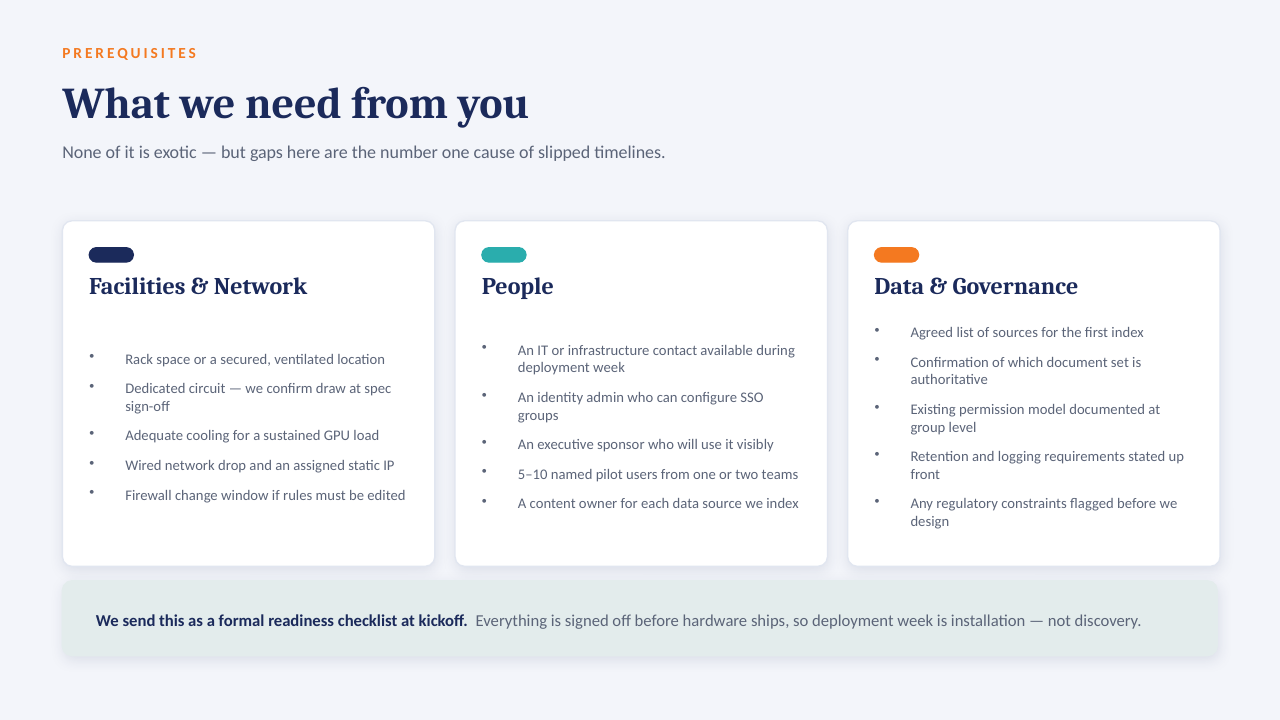
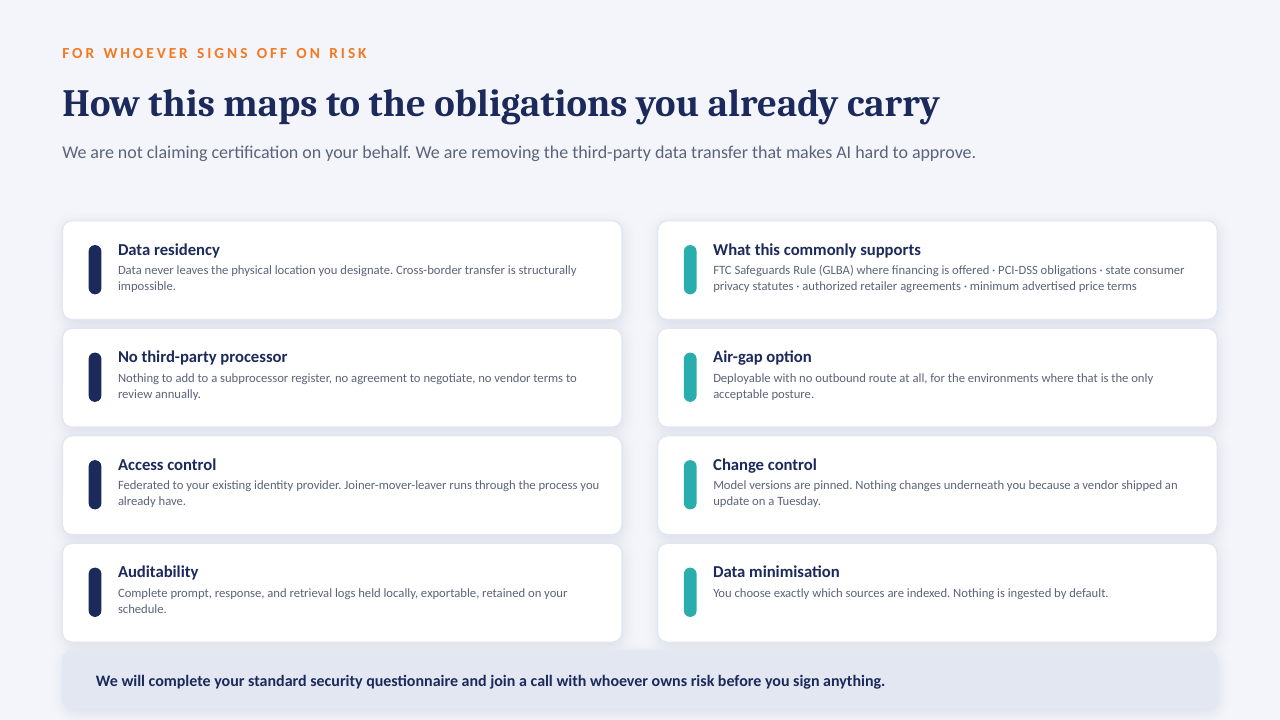
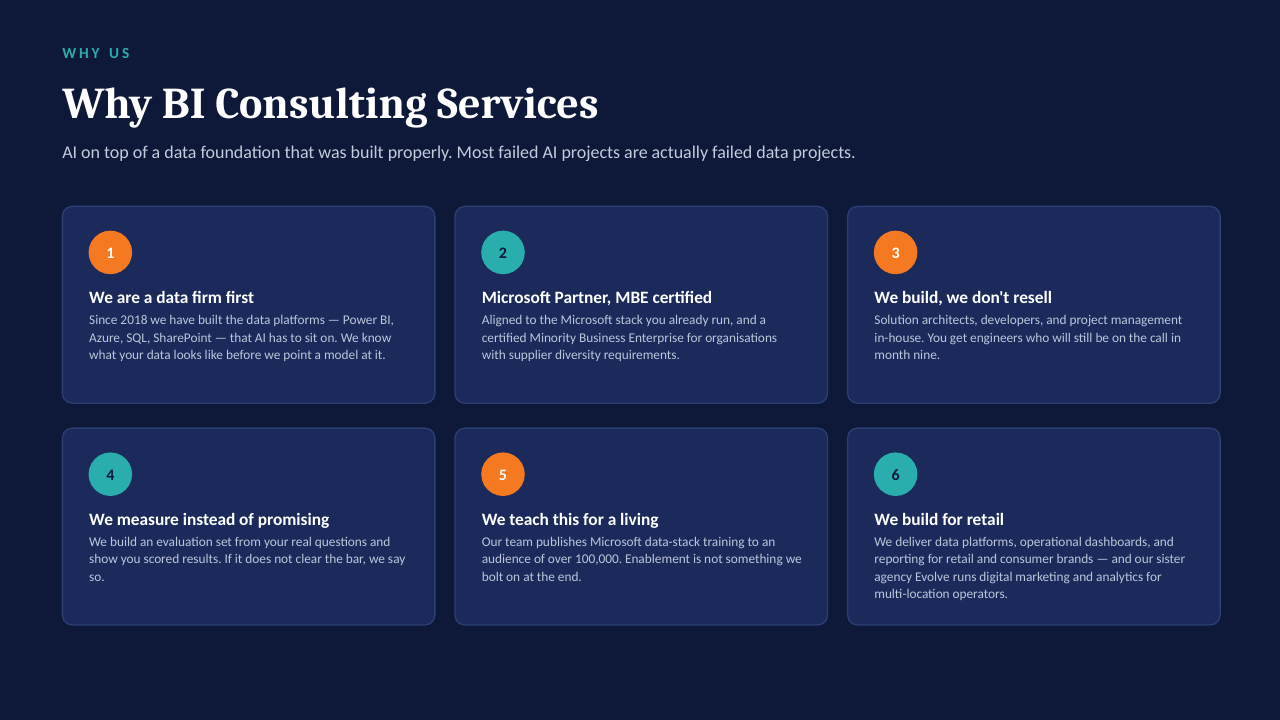
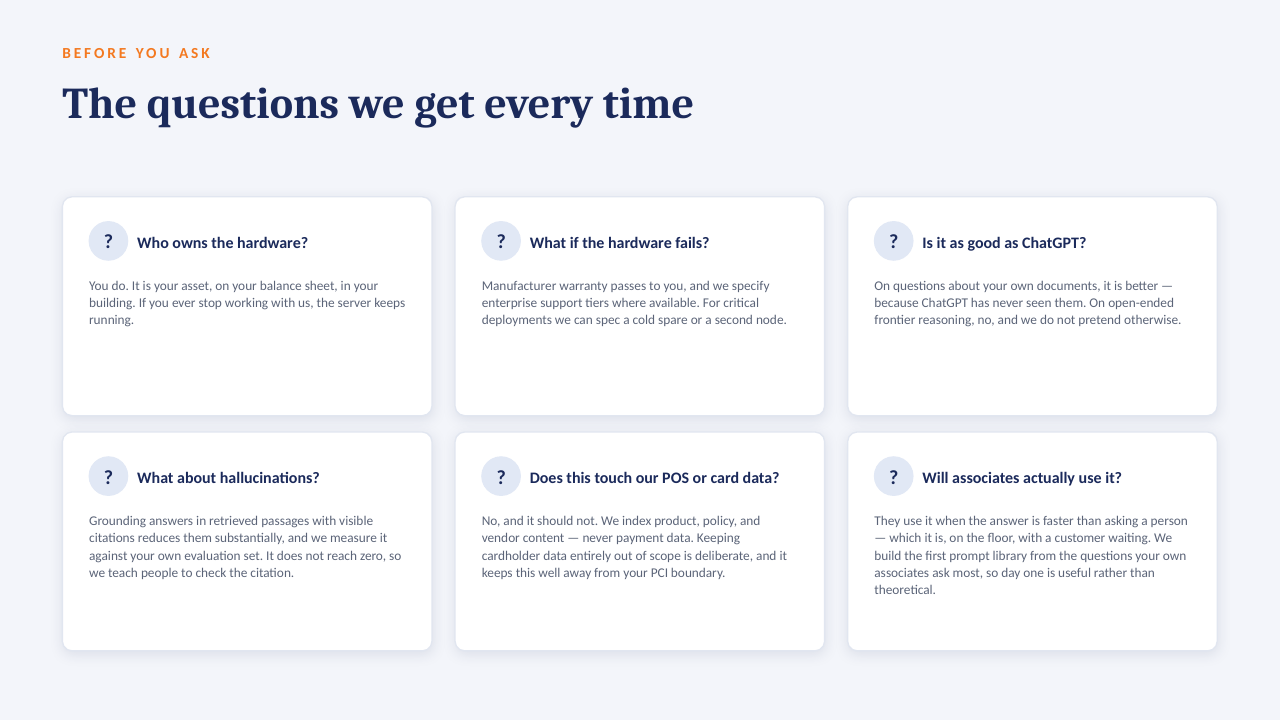
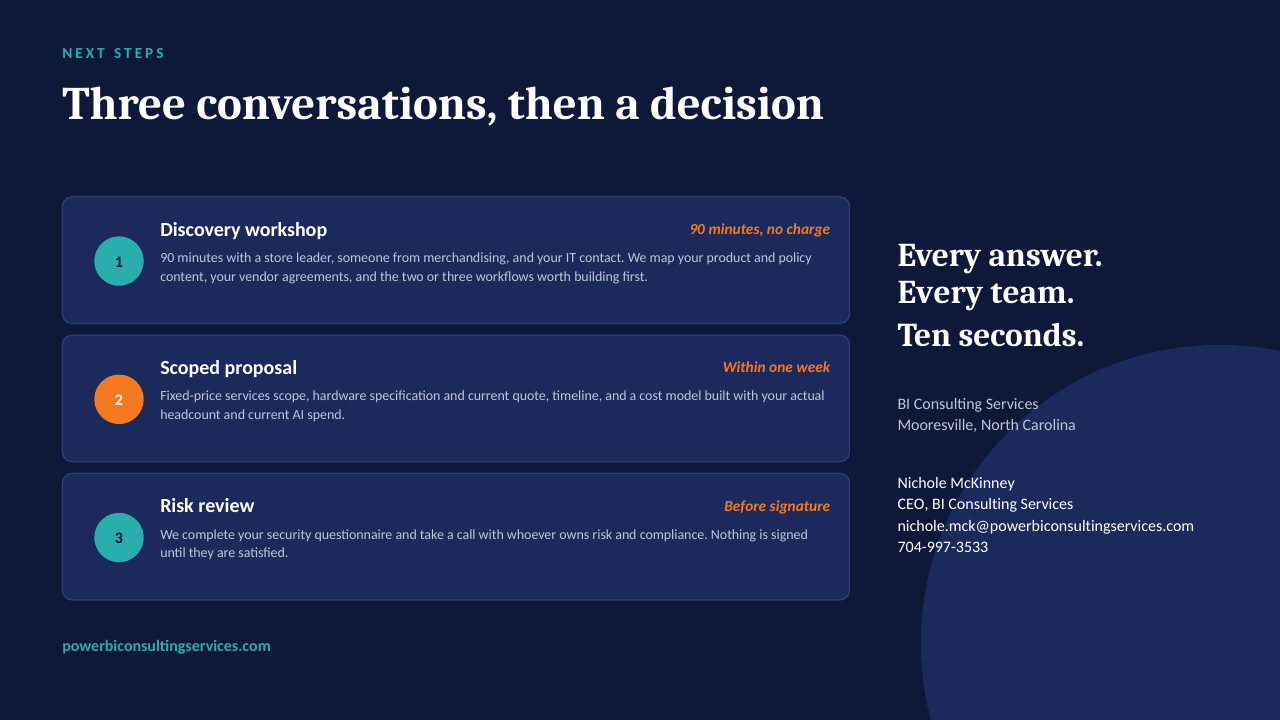
The "ask the data" ideas on this board are designed to run on a GPU server inside your own network — an open-weight model over your own documents, cited answers, no per-seat licence, nothing leaving the building. The short deck below explains how it works. Scroll through, or download it as a PDF.
Questions? Book 30 minutes: calendly.com/powerbiconsultingservices/30min